
- Decline in context: The EU’s falling share of global GDP largely mirrors America’s when measured at purchasing power parity, reflecting rising incomes in the global south rather than European failure.
- Inequality is falling, not rising: The ratio of the richest to the poorest fifth of EU citizens has dropped steadily since 2018, driven by catch-up growth in Central and Eastern Europe and pandemic-era income-support measures.
- A shifting income pyramid: Nearly 30 per cent of the EU’s poorest quintile now comes from the rich northwest, up from 5 per cent in 2014, as Central and Eastern Europeans escape the bottom ranks.
- Southern stagnation persists: Mediterranean economies recovered their pre-crisis relative position only after a lost half-decade of austerity, and their share of both the poorest and richest EU quintiles has barely moved.
- Progress at risk: Neoliberal competitiveness agendas, nativist populism, and Trumpian geopolitical framing threaten the cohesion gains the EU has quietly achieved.
The European Union has a bad image nowadays. The new US National Security Strategy posits that “Continental Europe has been losing share of global GDP—down from 25 per cent in 1990 to 14 per cent today…. But this economic decline is eclipsed by the real and more stark prospect of civilizational erasure.” In fact, Europe is in much better shape than this disingenuous vituperation suggests.
True enough, the EU’s share of global gross domestic product has declined. But this is primarily due to the strong growth of other parts of the world economy, notably China’s. America’s share has declined too, albeit more slowly when measured at exchange rates (see Figure 1, the two top curves). Yet, the apparent strength of the US economy is largely an artefact of a strong dollar. Measured at purchasing power parity, which reflects the true volume of goods and services produced domestically, America’s decline after 2000 tracks Europe’s closely (see Figure 1, the two bottom curves). In the end, both economies “suffer” from a genuinely good thing: the rising incomes of many formerly poor people in the global south.
Figure 1: The EU and US share of World GDP at exchange rates and purchasing power (in %)
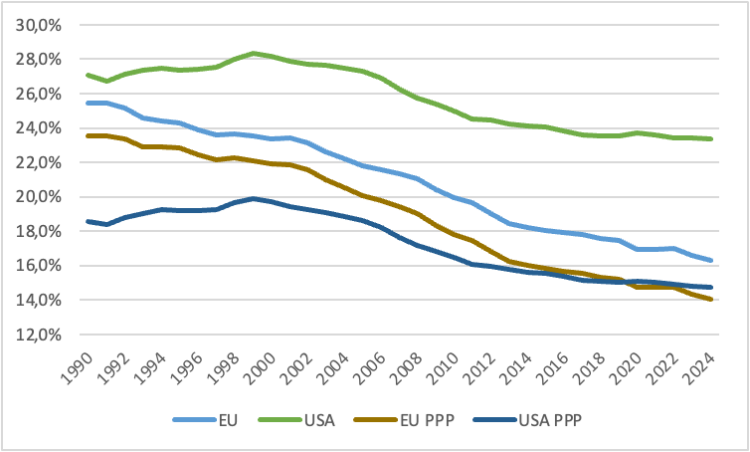
Source: World Development Indicators and calculations by the author
Smart, Progressive Thinking on the Big Issues of Our Time
Join 20,000+ informed readers worldwide who trust Social Europe for smart, progressive analysis of politics, economy, and society — free.
Europe’s more relevant success is the cohesive growth within the Union over the last decade, despite several dramatic shocks — the migration crisis in 2015, Covid in 2020, and the Ukraine war since 2022. This development, already visible in 2024, has continued, as Figure 2 shows. EU-wide inequality has declined further. It is measured here as the ratio of the incomes of the richest 20 per cent of the EU population to those of the poorest fifth, usually called the S80/20 ratio. Once again, a feature of international income comparisons that also shaped the EU–US comparison comes into play: the impact of how incomes are measured. Income disparities in the EU, too, are much lower when measured at purchasing power parity (the middle curve in Figure 2) than when measured nominally in euros (the top curve in Figure 2).
Figure 2:EU-wide inequality 2005-2024 (S80/S20 ratios)
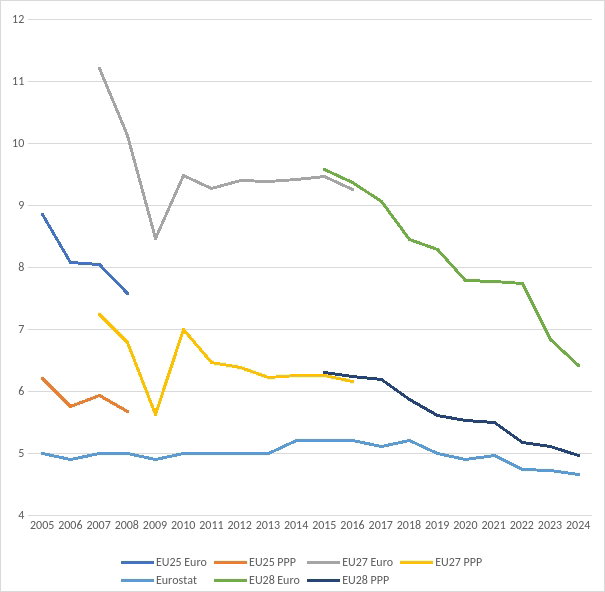
Which forces have driven this propitious development? In the longer run, it was catch-up growth in Central and Eastern Europe that was overwhelmingly responsible, while income distribution within countries hardly changed (see Figure 2, lowest curve). But this shifted after 2018, when inequality within countries began to decline on average as well. Both drivers will be analysed more closely below.
Declining inequality within member states
At a time when many people complain about rising inequality, it might be surprising that the official statistics show a different picture (see Table 1). Two reasons could explain this inconsistency. First, most complaints refer to the distribution of wealth, whose inequality has indeed increased. Second, there is large variation between countries. While some strongly reduced inequality, others hardly changed or even became more unequal. Tellingly, many countries that were particularly unequal in 2018 — such as Romania, Bulgaria, the Baltic states, Italy, and Spain (with values above 6, highlighted in red in Table 1) — reduced their inequality substantially. Conversely, some traditionally egalitarian countries became less so, among them Austria, France, Denmark, Finland, Sweden, Slovakia, and Slovenia (highlighted in blue in Table 1).
Table 1: Inequality within member states (S80/S20 ratio)
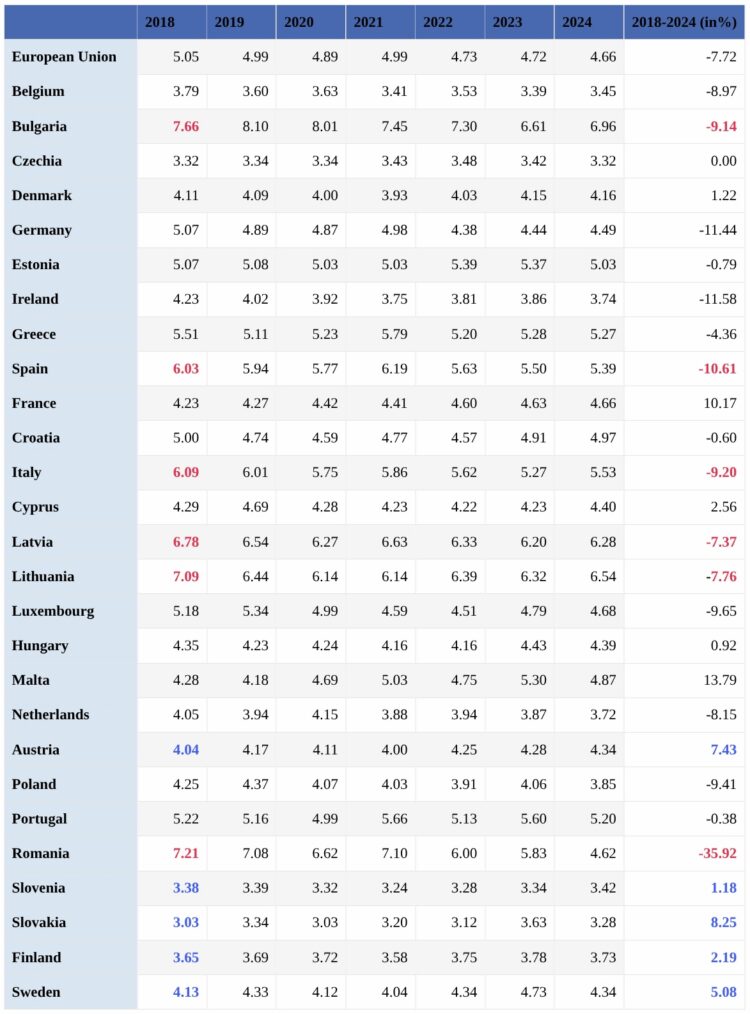
Source: Eurostat and author’s calculations
Analysing the different national developments behind these changes is beyond the scope of this brief overview. But it is likely that the various income-support measures adopted by national governments during the pandemic and in the wake of the energy crisis triggered by the Ukraine war and subsequent sanctions played a significant role. Many of the countries with declining inequality were also among the main beneficiaries of the EU’s Next Generation programme, which introduced a new approach based on common debt within the traditionally austere EU policy framework.
The east is catching up
The primary driver of the decline in EU-wide inequality has been the relatively strong growth of Central and Eastern Europe. Table 2 compares the growth of per capita income across three regions of the EU: the rich northwest (NW), Central and Eastern Europe (CEE), and the southern periphery (SP) — comprising Portugal, Spain, Italy, Greece, Malta, and Cyprus. As the last column shows, Central and Eastern Europe’s average GDP per person increased by about 300 per cent, reaching 44 per cent of the level of the rich northwest in 2024, compared with 19 per cent in 2004. In contrast, the Mediterranean countries, which started in 2004 with a GDP per person amounting to 73 per cent of the rich northwest, only improved their position until 2009 and then lost those gains in the financial crisis and the subsequent sovereign-debt panic, with its harmful austerity policies. The period from 2009 to 2014 was a lost half-decade. Yet this strong relative improvement masks a rise in absolute disparities. As the data in the rows labelled NW–CEE and NW–SP show, the gap between incomes per capita increased despite the stronger growth — except before 2009.
Table 2: Convergence and Divergence 2004-2024
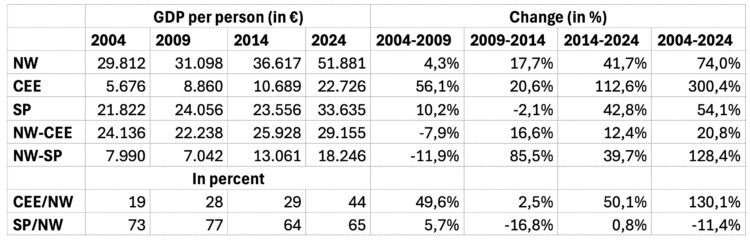
Source: Eurostat and author’s calculations
Nonetheless, the composition of the EU’s income pyramid is changing. The calculation behind Figure 1 compares the income of the poorest (Q1) and the richest quintile (Q5) of the EU, each composed of about 85 million people belonging to the national quintiles with the highest or, respectively, lowest per capita incomes in the overall ranking of the 135 (= 27×5) national quintiles. Figure 3 shows how the composition EU-Q1 and EU-Q5 has changed since 2014, when incomes are measured at PPP.
Figure 3: The changing composition of the poorest and richest quintiles of the EU’s population
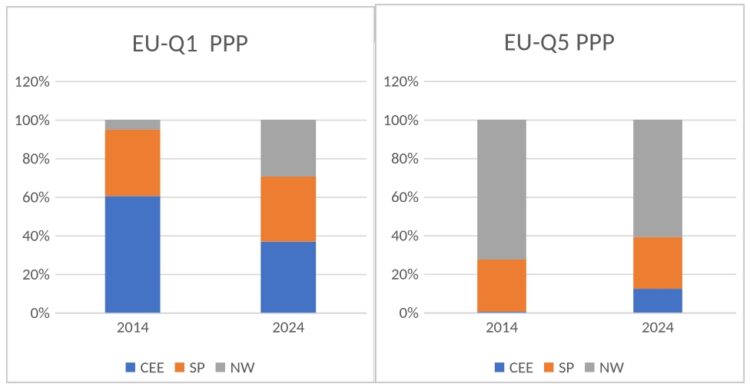
While in 2014 only 5 per cent of the people forming the poorest EU quintile came from the rich northwest, by 2024 the corresponding share was almost 30 per cent. It was people from Central and Eastern Europe who escaped from the bottom fifth of the EU income pyramid, while the share of the south remained virtually constant. For the richest fifth, the picture mirrors that development. In 2014, only the richest Slovenian quintile (0.5 per cent) made it into the top EU quintile. By 2024, Central and Eastern Europe’s share of the richest fifth had risen to about 12 per cent — again at the “expense” of the rich northwest and with a stable share from the south.
A more cohesive EU
The progress presented above is praiseworthy, but there is still a long way to go to achieve a Union that ensures the “harmonious development by reducing the differences existing between the various regions and the backwardness of the less favoured regions,” as the EU treaties require. Unfortunately, even the achievements so far are endangered by new crises, a renaissance of neoliberal economic and social policies obsessed with competitiveness, and the rise of nativist populism. The worldview of a Trumpian America, as spelt out in the National Security Strategy, should not inform European integration. The rise of the poor is something not to be feared but to be welcomed — ethically and economically desirable.